
We are very excited about our Social Media Analytics Workshop at Museums and the Web on April 8th (MW2015). In this post, we will focus on some of the topics we will deal with in the workshop, and how and why we will introduce some SNA (Social Network Analysis) tools, to better understand Social Networks.
Are you thinking about enrolling but have not yet made your mind up? We hope this post will help you to decide.
We started to approach Social Network Analysis with a new methodology on 2012, as we were not satisfied with the current approach, based on aggregated values: number of followers, number of likes and comments per post, number of retweets, etc. Even if these variables are useful, they do not succeed in grasping the nature of social networks, the connections between users, the communities they form and the flow of information through the network. Moreover, we can use them to evaluate the result of an action, but they do not help much to understand why an action has succeeded or failed.
These were the main reasons that lead us to work on Social Network Analysis through a new approach. The dissatisfaction with the old approach was shared with some more people, as shown by the fact that several books on graph-based Social Network Analysis have been published on late 2013 and 2014. They share with us some of the concepts from the Graph Theory and Network Science and some of the tools, but each approach has some particularities, and so has ours.
Let’s start with an example. The image bellow shows the mutual relationships between 500 museums worldwide during a year. It is a selection of a larger data set including almost 2,000 museums.
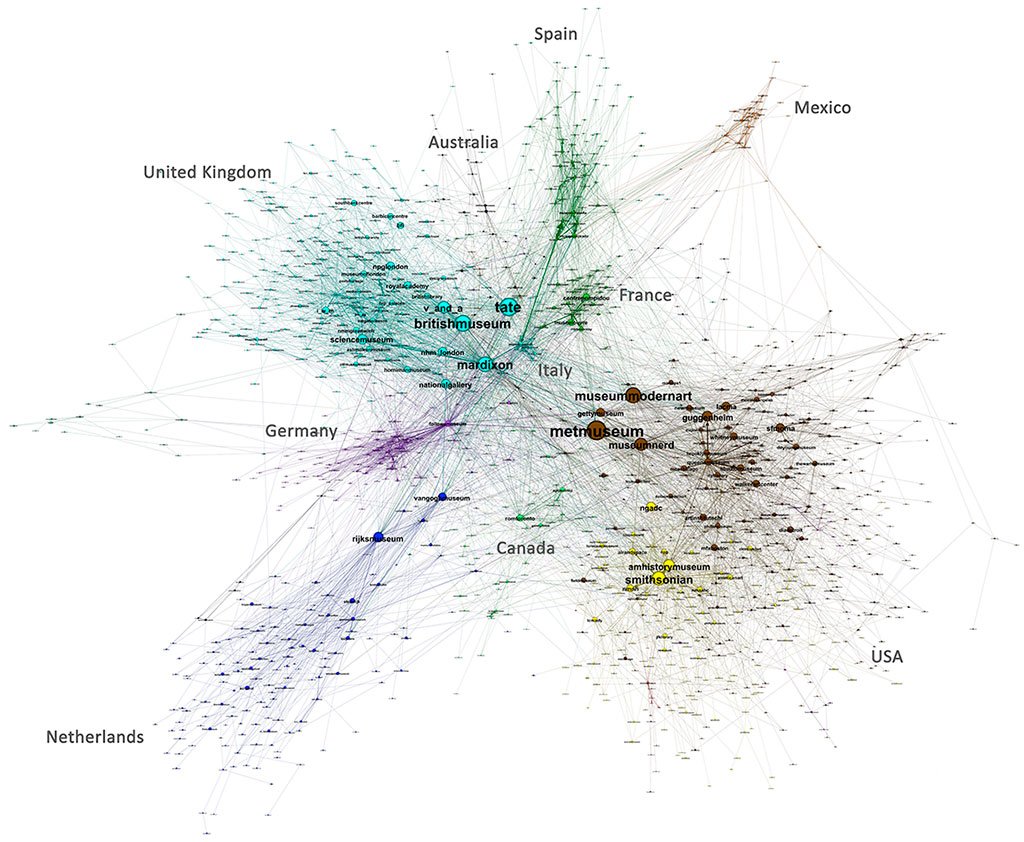
With the standard (i.e. non-networked) approach we can summarize this example by saying it includes 500 museums, 1.546.168 tweets, 79.362 connections and 18.905 unique connections. We can even determine who are the most mentioned and most prolific users. However, without SNA tools we lack a way to approach the community structure, which in this case is shaped by country communities. Likewise, we cannot assess the real influence of a museum within a community, when assessing users’ influence within a community is a key factor for designing more informed goal-oriented Social Media strategies.
Another example would be analyzing the structure of the community around the Victoria and Albert museum (Twitter profiles that have either mentioned or been mentioned by the V&A during a 7-month timespan, and all mentions and retweets between them):
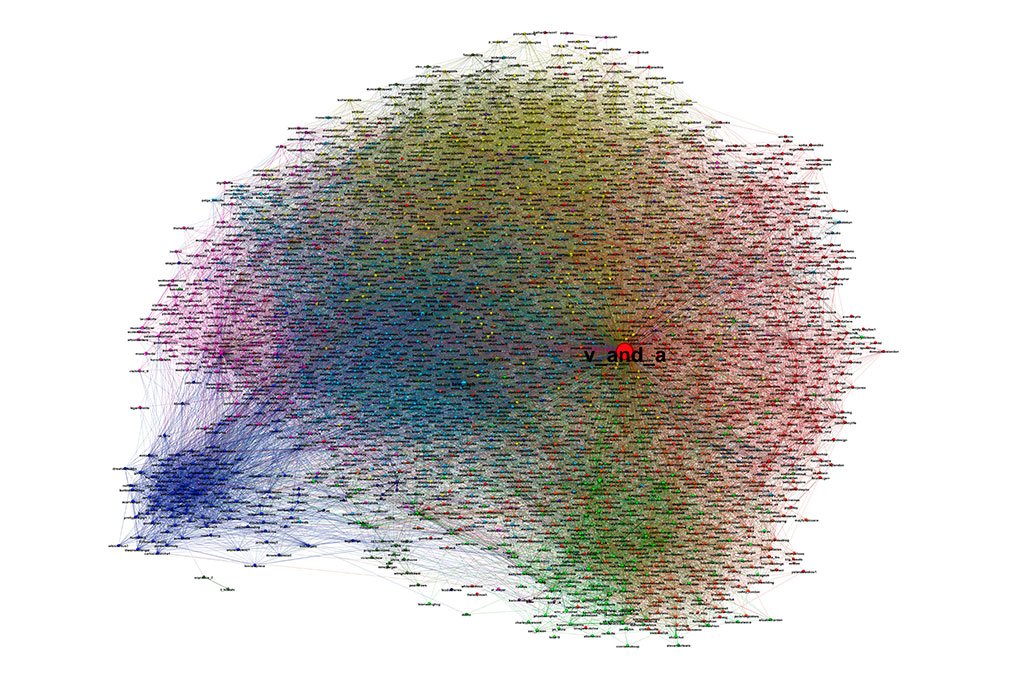
Once more, we can try to describe it through aggregated variables, such us number of users involved, number of tweets and so on. Yet, to grasp the nature of this network and to take advantage of this information, we need new concepts. Some of the concepts we will introduce in the workshop are:
- Community: what is a community? Why analyzing the community structure around your museum matters and how will it help you to define a more effective communication? How can your museum take advantage of analyzing other museum communities, particularly those from the same town or focused on a similar topic?
- Influence. We will introduce a naïve concept of influence and how influence is different to having the largest number of followers. We will go through the difference between influence in a certain group or conversation (for instance the Twitter talk around #mw15) and Twitter influence in absolute terms, which can be measured by a tool like Klout. We will also introduce Klout, whose algorithm extensively uses this graph-based approach.
- Social Networks growth mechanisms, including reciprocation and triadic closure (which is a very simple idea, despite the name).
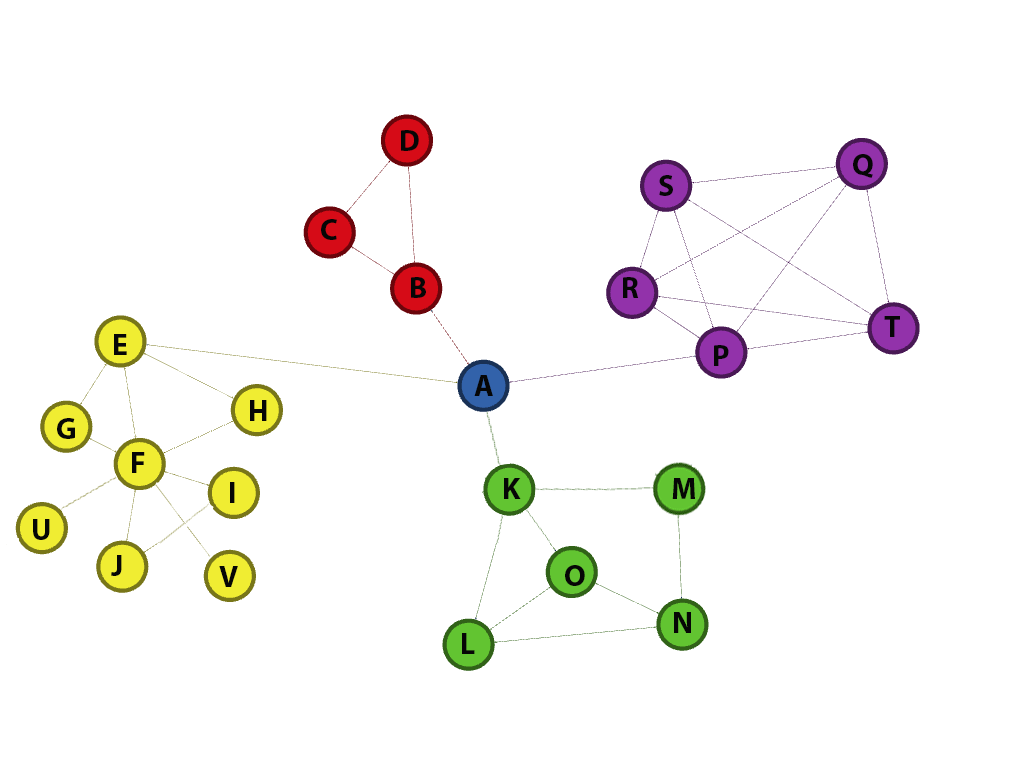
The difference between influence and having the highest number of followers is shown in this image. Although F has more followers than A, A is the key node in this small graph in which each community has a different color.
The definitions involve quite a lot of Math, so we will focus on the intuitive concepts behind them which are usually straightforward.
Quite often, the chart of followers growth of a medium-sized mused has a shape similar to this one:
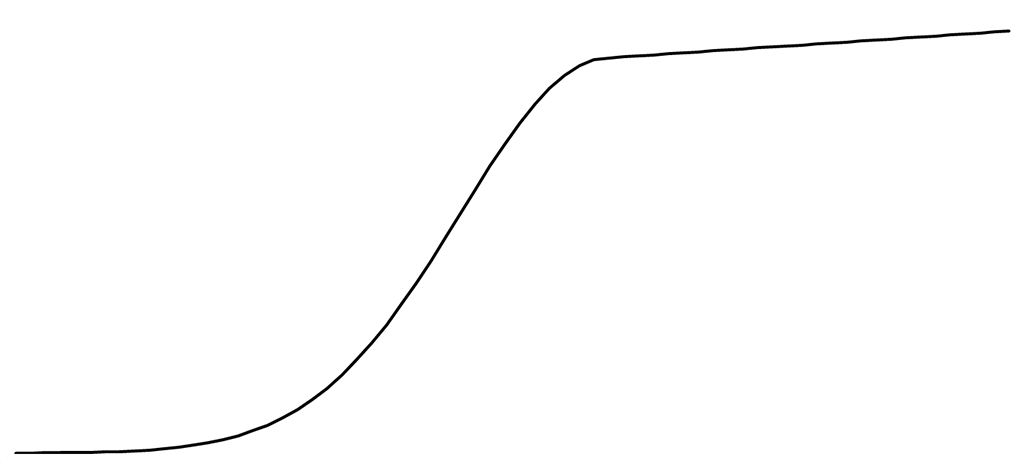
The growth rate is slow at the beginning and it speeds up after a certain threshold. At a certain moment it may give the impression of starting a path of straight growth that will keep on forever, but after a while we detect some signs of stagnation, and although we keep growing, the growth rate is much slower. Not all museums experience this pattern though, but many do. The concepts we will introduce (especially the community concept) help to understand why this happens, and how to design strategies to overcome this problem.
The workshop aims at providing you with a new toolset that you can use to analyze your museum situation and challenges. You will be able to ask questions related to specific challenges you have, and we will do our best to approach them during the workshop.
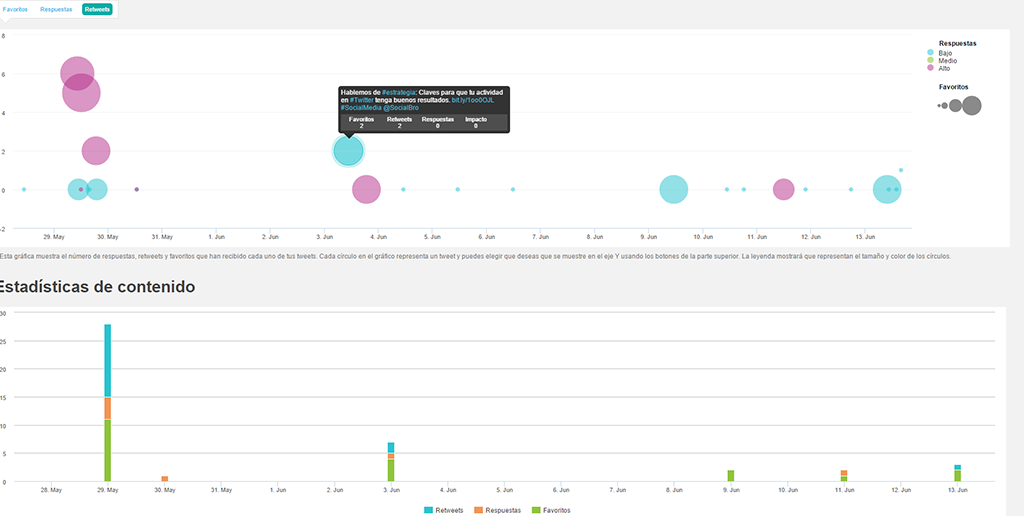
We will also introduce some inexpensive Social Media tools to help you become more effective in your daily Social Media work.
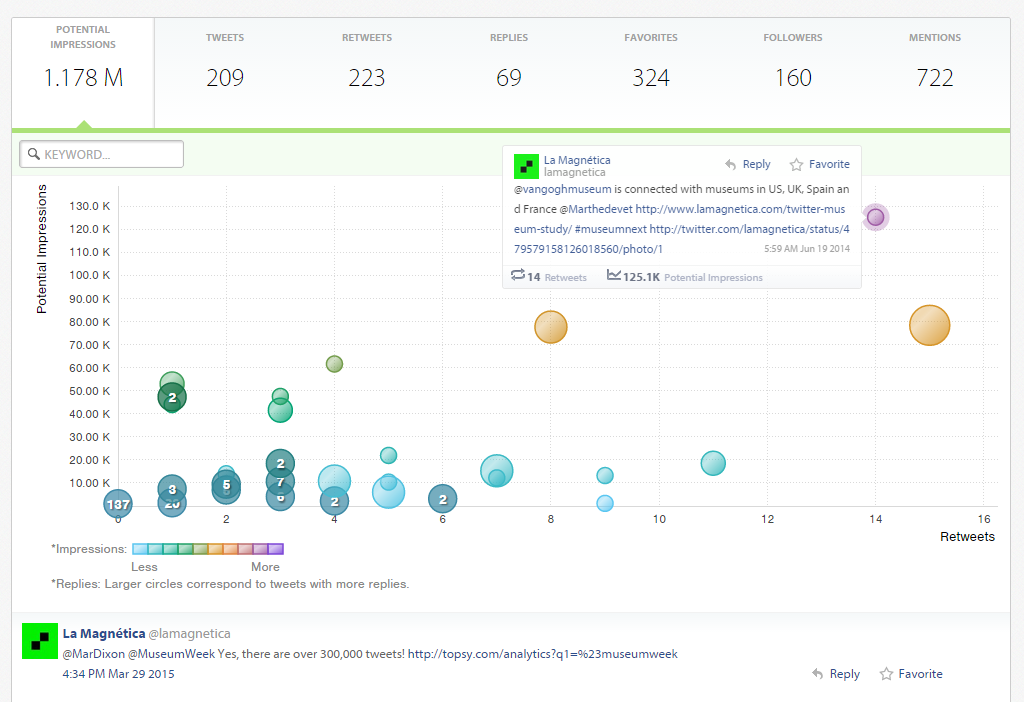
This graph shows tweets that have been published during a certain period of time classified by the numbers of retweets they have received and the number of potential impressions they have generated. Placing the mouse over each point triggers a pop up that shows the content of the tweet, and the user who has retweeted it. Using this tool makes it easier to detect which are the topics that generate more retweets, who are our key followers that help us reach new audiences, etc.
Do not forget to bring your laptop to the workshop if you have it with you in Chicago. You will also need your museum’s Facebook and Twitter U&P. The workshop hashtag will be #mwmetrics.
You can register selecting the “Social Media Analytics Workshop” by clicking here.

