Museum Next’s Conference was held from June the 18th until June the 20th. Participants from all over Europe joined to exchange ideas on museum’s innovation and technology, and we were able to follow this activity on Twitter.
On June the 4th we started to monitor the hashtag #museumnext –in order to analyse the movement that the conference was creating on Twitter– and we published a post in our blog with the results prior to the beginning of the conference.
So, now that the conference is over, we are going to analyse, using Social Network Analysis, the underlying relationships that have taken place on the #museumnext Twitter talk.
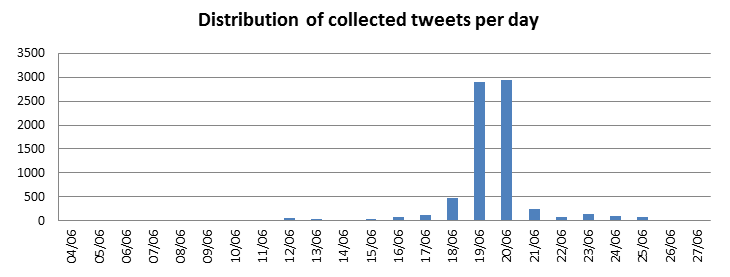
We have collected a total of 7.359 tweets from 1.437 different users. Of all these tweets, over 85% have been published between June the 18th and June the 20th.
Every user has published an average of 5.12 tweets using the #museumnext hashtag.
In order to represent the relationship between these users we have focused on mentions and retweets (RTs) on the collected tweets. We have created a graph where every node is a user that has done or has received a mention in at least one of the collected tweets, and every arrow indicates a mention or a retweet from one user to another.

This graph is formed by 1,604 users and 6,202 unique mentions and retweets between them (over 10,000 total). You can download the high-resolution image here.
In this case, more than 97% of users are in the giant component –which means that only 3% of users are not connected to the main component in the graph. We focus on the main component that includes all influential users and their conversations.
MuseumNext and Museums and the Web
In order to help us understand MuseumNext’s results (June), we are going to compare them with the ones from Museums and the Web (April) and Museums and the Web Europe (February). We do not intend to establish a ranking or saying which conference has had the greatest impact, but the comparison between conferences helps us showing their differences and similarities, and helps to make sense of some of the variables that otherwise may seem a bit too abstract.
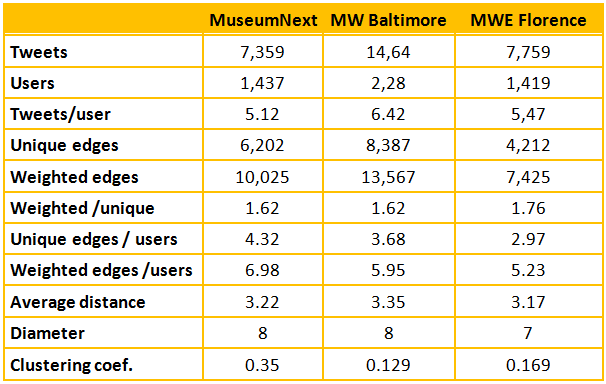
Museums and the Web has had the biggest figures in terms of users and tweets. And the two European conferences have had very similar results: around 7,500 tweets by 1,400 users.
The average distance is very similar in all three cases. 3.2-3.4 is quite a low average distance for graphs containing 1,400 to 2,280 users. That points out to the fact that all three conferences have done a very good job when bringing the museum community together. The diameter (maximum distance between two users) is also quite low.
The similarities indicate a common behaviour within the museums’ community, where there are no real competitors, and where collaboration and open discussions of museum’s experiences are possible. When we analyse conferences about other sectors where competition is tougher, results are very different.
But there also some differences worth noting:
- #museumnext’s mentions involve more users than #mwf2014 ones, perhaps due to the fact that MuseumNext has a more established community than Museums and the Web in Europe, which was the first edition.
- There is a clear graduation in the number of mentions and RTs and in unique mentions and RTs (that counting once each pair of users, regardless of the number of mentions or RTs between them).
- MuseumNext Twitter users mention more often than the Museums and the Web ones, but the difference is not so big to draw any clear consequences from this fact.
No communities. What does it mean?
The graph doesn’t have a clear community structure. Neither did Museums and the Web in Baltimore, with the exception of the Italian cluster led by Svegliamuseo, who kept up to date many Italian users who were not attending the conference.
On the other hand, Museums and the Web Florence had a more clearly defined community structure leaded by the official conference bloggers and by several museum professionals that were very active and formed communities (some of them country-based) around them. This situation reflects a forming community around the conference, while the other two reflect a more mature community where loyal attendees have dozens of acquaintances and glue the structure of the conversation around the conference in a single group. You can always detect significant subgroups inside it, but is mainly a single community.
The core graph

You can download the high-resolution graph here.
This new graph represents the same kind of relationships that the previous one, but now we just maintain users that have relations with more than two arrows pointing them or starting from them. This graph contains 746 users and 5.024 relations between them, which means that 46.51% of the users concentrate the 81.01% of relations, if we compare with the main graph.
Top users
Ranking by PR (a measure of influence):
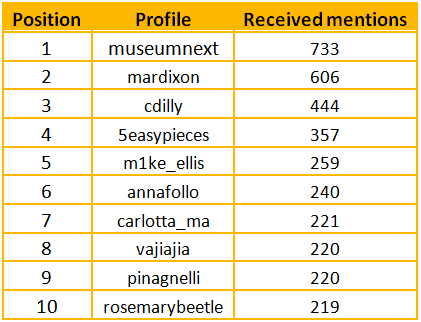
Ranking by mentions received:
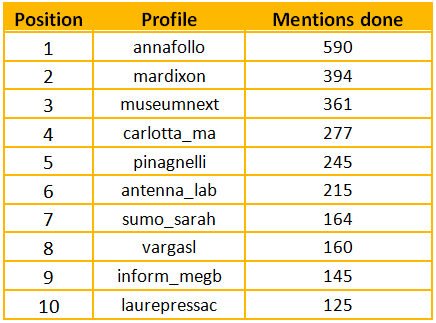
Ranking by mentions done: